Miscellaneous
Demographics of Participants
Our participants have come from across the U.S. and many different institutions. The following table lists all institutions of our participants from 2001 – 2025. The number in parentheses indicates how many students have come from that institution, if N>1.
|
Austin Peay State Univ. Ball State Univ. (2) Bates College Birmingham-Southern College Boston College Brooklyn College Bronx Community College Bucknell University California State Univ. Fullerton California Univ. of Pennsylvania (4) Cameron University Carleton College Central Methodist Univ. Central Michigan Univ. (5) Central Washington Univ. Citrus College City Univ. of New York Clark Univ. Clemson Univ. Cleveland State Univ. Cornell Univ. (3) Davidson College DePauw University Earlham College East Carolina University (2) East Central University (4) Embry-Riddle Aeronautical Univ., Prescott (2) Embry-Riddle Aeronautical Univ., Daytona Beach Florida International University (3) Florida State University (3) Georgetown Univ. Georgia Institute of Technology Howard Univ. Indiana University (4) Iowa State Univ. (5) Jackson State University (6) Langston University Louisiana State Univ. Loyola Univ. Chicago Luther College Lycoming College Metropolitan State Univ. of Denver (2) Michigan State University |
Millersville Univ. (10) Minnesota State Univ. Montana State Univ. Morgan State Univ. Mount Holyoke College (2) Murray State Univ. Muskeegon Community College North Carolina State Univ. (6) Northern Illinois University (8) Northland College (3) The Ohio State University (4) Oklahoma State University Olivet Nazarene University Pennsylvania State University (7) Pittsburg State Univ., Kansas Plymouth State Univ. (5) Purdue University (3) Rhodes College Rice University Rutgers University (4) Saint Louis Univ San Jose State Univ. (2) St. Cloud State Univ. (6) St. Francis University Southern Illinois Univ., Edwardsville SUNY Albany (3) SUNY Brockport SUNY Oneonta (2) SUNY Oswego SUNY Stony Brook South Dakota School of Mines & Tech. (3) Southwestern Oklahoma State Univ. (2) Texas A&M University (4) Texas A&M Univ. Commerce UCLA (2) Univ. Alabama Huntsville Univ. Alaska-Fairbanks Univ. Central Arkansas Univ. Central Oklahoma Univ. Colorado Boulder Univ. Delaware Union University |
Univ. Florida Univ. Georgia at Athens (8) Univ. Hawaii Manoa Univ. of Illinois–Urbana Champaign (3) Univ. Kansas Univ. Louisiana at Monroe (4) Univ. Maryland College Park Univ. Massachusetts Lowell (2) Univ. Maine at Farmington Univ. Miami, Coral Gables (6) Univ. Mississippi Univ. Missouri (2) Univ. Nevada Reno Univ. North Carolina–Asheville (4) Univ. North Carolina–Charlotte (3) Univ. North Carolina-Pembroke Univ. Nebraska–Lincoln Univ. Northern Colorado (7) Univ. Oklahoma (6) Univ. Puerto Rico, Rio Piedras Univ. Puerto Rico, Mayaguez (3) Univ. South Alabama Univ. South Florida Univ. Tennessee, Knoxville Univ. Texas at Arlington Univ. Texas at Austin (2) Univ. Texas Pan American Univ. Virginia Univ. Utah Univ. Washington Univ. Wisconsin-Madison (2) Univ. Wisconsin-Milwaukee Univ. Wisconsin-Stevens Point Valencia College Valparaiso Univ. (25) Vermont State University-Lyndon (was Lyndon State College) (6) Virginia Tech Western Connecticut Univ. (2) Western Kentucky Univ. (4) Wofford College Worcester State Univ. |
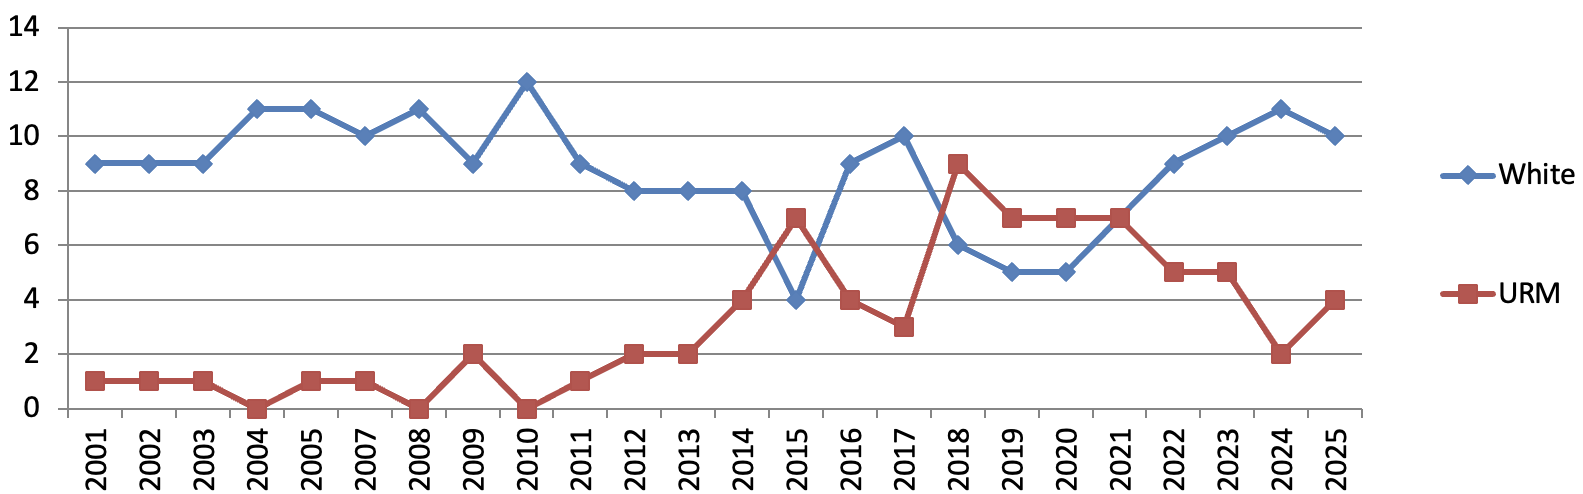
As the overall population demographics and application patterns have changed in the US, so have our participants. URM means any race or ethnicity that is considered underrepresented in the sciences. The total number of students has varied from 10 to 14.
Academic Status or Achievement of Past Participants
Of alumni who have completed their bachelor's degree, 82% have earned a graduate degree. While this is certainly a positive outcome, the goal of an REU is clarity for any career direction, no matter what terminal degree that might imply.
| In School, Pursuing Degree | Highest Degree Achieved for Those No Longer in School | |||||
|---|---|---|---|---|---|---|
| B.S. | M.S. | Ph.D. | B.S. | M.S. | Ph.D. | |
| Number of participants | 24 | 31 | 13 | 35 | 105 | 49 |
| Expressed as % | 35% | 46% | 19% | 19% | 56% | 26% |
Table updated August 2020
Work Status of Past Participants
Of those alumni who are now working, about 75% are in meteorology or a related field (related field examples: emergency management, science curriculum design or teaching, science writing). Some alumni had been in the field before their careers took them in new directions. Some who are not working in meteorology were from majors outside meteorology and returned to those disciplines. In a few cases a meteorology major left the field for another job, to follow a spouse, or to raise children.
| Meteorology | Related Field | Non-Meterology | Not Working | Unknown or Deceased | |
|---|---|---|---|---|---|
| Number of Participants | 131 | 26 | 30 | 9 | 13 |
Table updated August 2020
Page Last Updated: Aug 26, 2025